Pier-Harbor
Overview
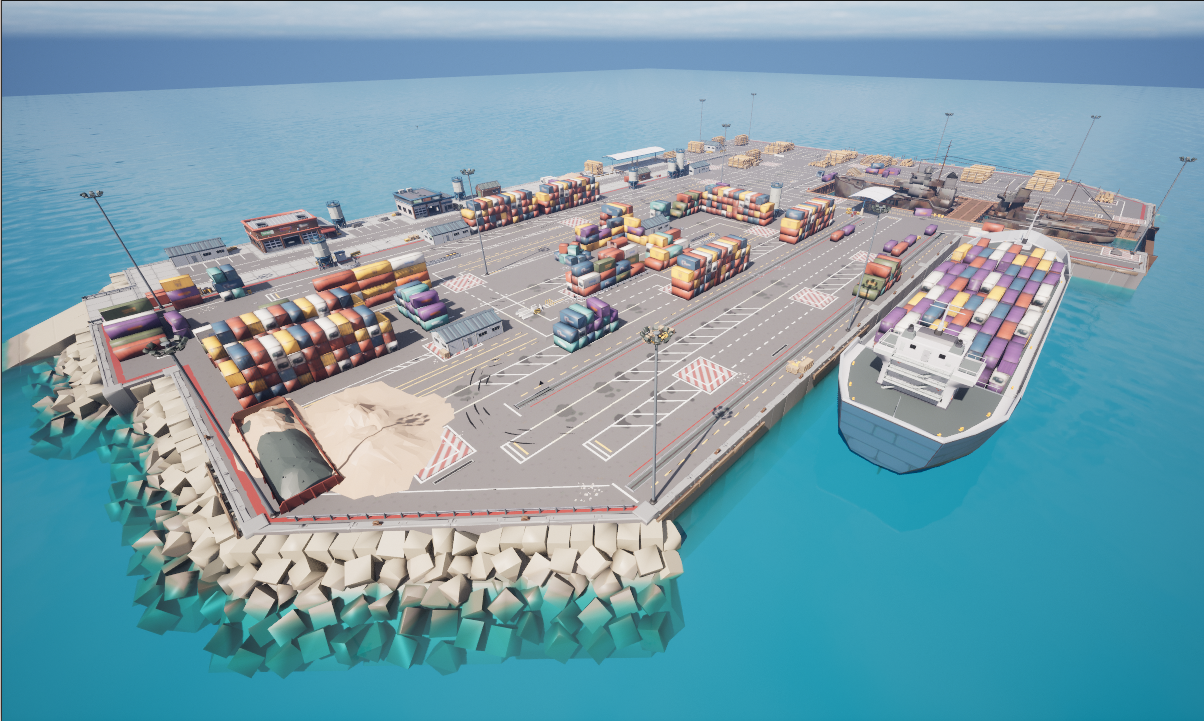
The Pier-Harbor environment is a coastal simulation space modeled after a functional port. It is designed for maritime inspection, docking maneuvers, and logistics automation. This map features various assets such as piers, ships, warehouses, and cranes, making it ideal for testing multi-agent systems in cluttered marine environments.
Environment Dimensions & Coordinates
BiguaSim uses a coordinate system where Z=0 represents the water surface. The maps below provide the exact spatial constraints required for mission planning within the harbor.
Coordinate Grid (Top View)
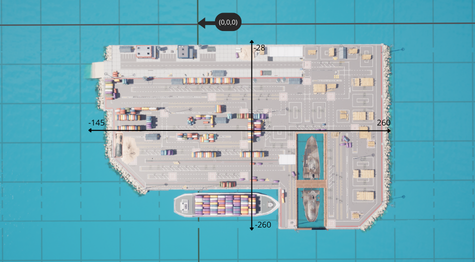
The top-down view shows the harbor’s layout. The longitudinal axis spans from -200 to 200 units, while the lateral axis ranges from -125 to 125 units. The coordinate origin is located at the center of the main dock, providing a consistent reference for global positioning and docking algorithms.
Depth and Altitude Profile
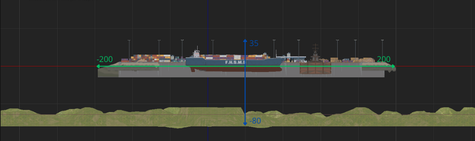
- This cross-section view illustrates the vertical operational envelope for harbor missions:
Maximum Altitude: Up to 35 meters above sea level (useful for crane and warehouse inspection). Maximum Depth: The harbor floor reaches down to -80 meters, suitable for hull inspections and seafloor mapping. Vertical Reference: The green line indicates the water surface (Z=0).
Landmarks and Waypoints
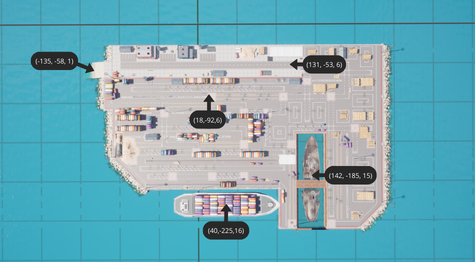
Key landmarks have been mapped to assist in automated navigation, docking maneuvers, and object recognition. The coordinates below (X, Y, Z) represent strategic operational points:
Harbor Entrance (-135, -58, 1): The primary entry point for vessels and ROVs into the protected harbor basin.
Container Yard (18, -92, 6): Central logistics area, ideal for testing obstacle avoidance and ground vehicle navigation.
Loading Dock (131, -53, 6): Key waypoint for ship-to-shore operations and autonomous mooring tests.
Moored Vessel (142, -185, 15): Landmark located on the ship’s structure, suitable for high-altitude drone inspection.
Cargo Carrier (40, -225, 16): Target waypoint for maritime delivery simulations and proximity sensing.
Semantic Segmentation Labels
The following table defines the semantic segmentation IDs and their corresponding RGB values for the Pier-Harbor environment. These labels are used to identify infrastructure, debris, and maritime assets.
Folder Title |
Stencil Value |
RGB Value |
|---|---|---|
None |
0 |
{0, 0, 0} |
HolodeckAgent |
1 |
{153, 108, 6} |
StaticMeshActor |
2 |
{112, 105, 191} |
Sky |
3 |
{89, 121, 72} |
Water |
4 |
{190, 225, 64} |
FloorDrain |
5 |
{206, 190, 59} |
Trash |
6 |
{81, 13, 36} |
RockWall |
7 |
{115, 176, 195} |
WoodenSupport1 |
8 |
{161, 171, 27} |
CoveredStructure |
9 |
{135, 169, 180} |
Tire |
10 |
{29, 26, 199} |
OilBarrel |
11 |
{102, 16, 239} |
SecurityBooth |
12 |
{242, 107, 146} |
Sand |
13 |
{156, 198, 23} |
Barricade |
14 |
{49, 89, 160} |
SandBox |
15 |
{68, 218, 116} |
Tower |
16 |
{11, 236, 9} |
Bollard |
17 |
{196, 30, 8} |
Dock |
18 |
{121, 67, 28} |
Boat1 |
19 |
{0, 53, 65} |
WoodBox |
20 |
{146, 52, 70} |
ConcreteBarrier |
21 |
{226, 149, 143} |
Container0 |
22 |
{151, 126, 171} |
Boat0 |
23 |
{194, 39, 7} |
Logs |
24 |
{205, 120, 161} |
RockFence |
25 |
{212, 51, 60} |
FloorStones |
26 |
{211, 80, 208} |
WoodenSupport |
27 |
{189, 135, 188} |
House1 |
28 |
{54, 72, 205} |
IronFence |
29 |
{103, 252, 157} |
House2 |
30 |
{124, 21, 123} |
DelimitedArea |
31 |
{19, 132, 69} |
Container1 |
32 |
{195, 237, 132} |
Container7 |
33 |
{94, 253, 175} |
Advertisements |
34 |
{182, 251, 87} |
Container5 |
35 |
{90, 162, 242} |
Street0 |
36 |
{199, 29, 1} |
House0 |
37 |
{254, 12, 229} |
Container6 |
38 |
{35, 196, 244} |
Pallets |
39 |
{220, 163, 49} |
Container4 |
40 |
{86, 254, 214} |
Container2 |
41 |
{152, 3, 129} |
Street2 |
42 |
{92, 31, 106} |
Street1 |
43 |
{207, 229, 90} |
Container3 |
44 |
{125, 75, 48} |
Landscape |
45 |
{98, 55, 74} |
PostProcessVolume |
46 |
{126, 129, 238} |
Any |
255 |
{255, 255, 255} |